
-
Learn the Basics
-
- Cards
- Card Icons
- Card Details
- Card Statuses
- Card Users
- Card Activity Stream
- Card Status Roles
- Dates in Cards
- Reminder
- Responsible Person
- Card Blockers
- Global Card Blockers
- Card Issues
- Adding Cards to My Space
- Hinzufügen von Karten zu "MySpace"
- Removing Cards from My Space
- Entfernen von Karten aus "MySpace"
-
- Creating Cards
- Changing Card Statuses
- Following Cards
- Scheduling Cards
- Renaming Cards
- Duplicating Cards
- Quick Actions
- Mass Actions
- Copy & Paste
- Creating Card Statuses
- Changing the Default Card Status
- Changing the Order of Card Statuses
- Deleting Card Statuses
- Moving Cards between Spaces
- Archiving Cards
- Unarchiving Cards
- Deleting Cards
- Creating Card Blockers
- Managing Card Blockers
-
- Documents in KanBo
- Card Documents
- Uploading or Creating Documents in Cards
- Attaching and Detaching Documents in Cards
- Space Documents
- Document References
- Document Sources
- Downloading Documents
- Editing Documents
- Editing Documents in Browser
- Editing Documents in Office Applications
- Renaming Documents
- Deleting Documents
-
Visualize Work
-
- Space Views
- Creating Space Views
- Personal and Shared Space Views
- Card Grouping
- Filtering Cards
- Display Settings
- Work Progress Calculation
- Grouping Description
- Card Grouping Settings
- Changing the Order of Groupings
- Changing the Order of Space Views
- Deleting Space Views
- Following Card Statuses and Custom Fields
-
-
Collaborate
-
Level Up Your Work
-
Work Securely
-
Integrations
-
- Advanced KanBo Actions in Power Automate
- Creating KanBo Space Attached to Subfolder Created by Power Automate
- Creating Document Folders in Document Libraries Created by KanBo with Power Automate
- Exporting Space Views to Excel
- KanBo and Azure Logic Apps Integration
- Power Automate Integration: Triggers and Actions
- Seamless Import from Microsoft Planner to KanBo
- Synchronizing KanBo with Outlook Calendar
- Using KanBo Outlook App
-
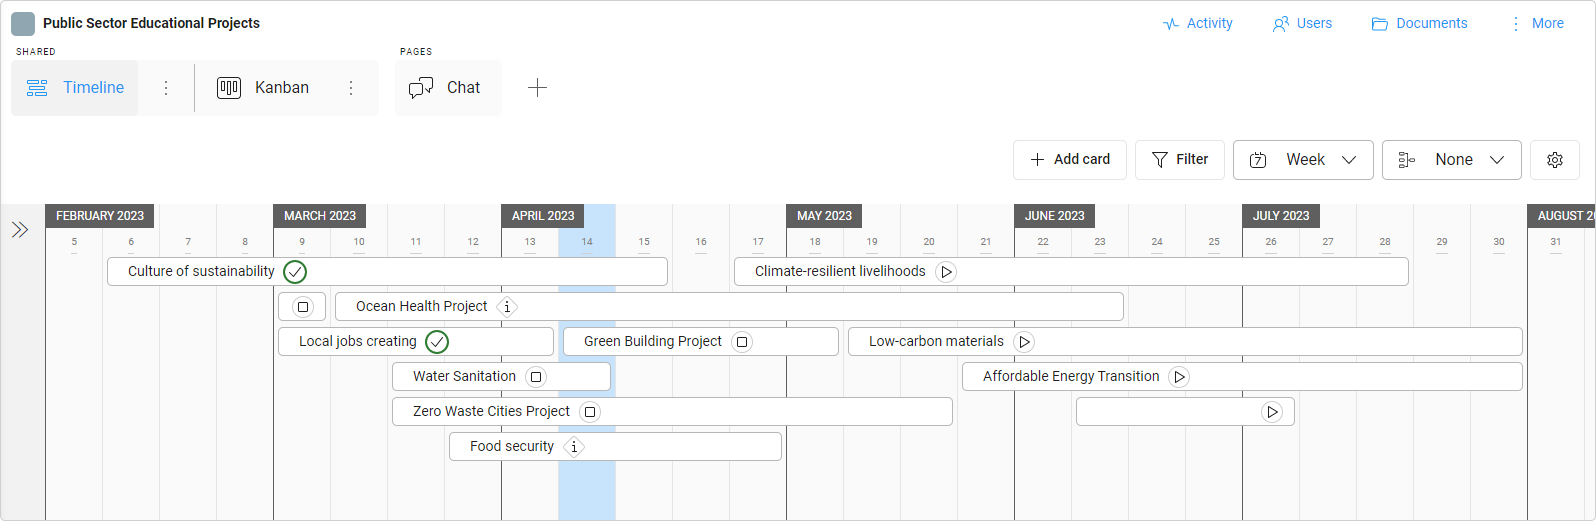
Timeline View
This post is also available in: Deutsch
The Timeline view is a powerful feature that provides a visual representation of all cards that need to be completed over a specific period. It allows space users to see a project’s progress and deadlines in a single view, making it easier to plan and manage their work.
Use this view to adjust the dates of your projects in a fast and easy way. Try to complete cards in sequence, not overloading yourself with too many activities at once. Use the Timeline view to control the workload and learn to prioritize your tasks.
The main purpose of this view is to organize the tasks you have to do and determine the order of activities.
Learn how to:
- create a Timeline view
- manage cards with the Timeline view – create new cards and change their groups
- adjust card dates with Timeline view to prioritize your work
- customize the Timeline view
Every card in the Timeline view is treated as a separate task. There is even an option to hide card names and concentrate on scheduling work only. If you want to focus on card relations and their time dependencies, try the Gantt Chart view.
Current time bar
The blue vertical bar in the center will highlight the present time unit (day/week/month/year etc.). This makes it easier for you to inspect the timeframes of card bars against the current date.
Watch the timeline and try to move tasks if there is too much to do, and place it where you can see free space.
Was this article helpful?
Please, contact us if you have any additional questions.