
-
Learn the Basics
-
- Cards
- Card Icons
- Card Details
- Card Statuses
- Card Users
- Card Activity Stream
- Card Status Roles
- Dates in Cards
- Reminder
- Responsible Person
- Card Blockers
- Global Card Blockers
- Card Issues
- Adding Cards to My Space
- Hinzufügen von Karten zu "MySpace"
- Removing Cards from My Space
- Entfernen von Karten aus "MySpace"
-
- Creating Cards
- Changing Card Statuses
- Following Cards
- Scheduling Cards
- Renaming Cards
- Duplicating Cards
- Quick Actions
- Mass Actions
- Copy & Paste
- Creating Card Statuses
- Changing the Default Card Status
- Changing the Order of Card Statuses
- Deleting Card Statuses
- Moving Cards between Spaces
- Archiving Cards
- Unarchiving Cards
- Deleting Cards
- Creating Card Blockers
- Managing Card Blockers
-
- Documents in KanBo
- Card Documents
- Uploading or Creating Documents in Cards
- Attaching and Detaching Documents in Cards
- Space Documents
- Document References
- Document Sources
- Downloading Documents
- Editing Documents
- Editing Documents in Browser
- Editing Documents in Office Applications
- Renaming Documents
- Deleting Documents
-
Visualize Work
-
- Space Views
- Creating Space Views
- Personal and Shared Space Views
- Card Grouping
- Filtering Cards
- Display Settings
- Work Progress Calculation
- Grouping Description
- Card Grouping Settings
- Changing the Order of Groupings
- Changing the Order of Space Views
- Deleting Space Views
- Following Card Statuses and Custom Fields
-
-
Collaborate
-
Level Up Your Work
-
Work Securely
-
Integrations
-
- Advanced KanBo Actions in Power Automate
- Creating KanBo Space Attached to Subfolder Created by Power Automate
- Creating Document Folders in Document Libraries Created by KanBo with Power Automate
- Exporting Space Views to Excel
- KanBo and Azure Logic Apps Integration
- Power Automate Integration: Triggers and Actions
- Seamless Import from Microsoft Planner to KanBo
- Synchronizing KanBo with Outlook Calendar
- Using KanBo Outlook App
-
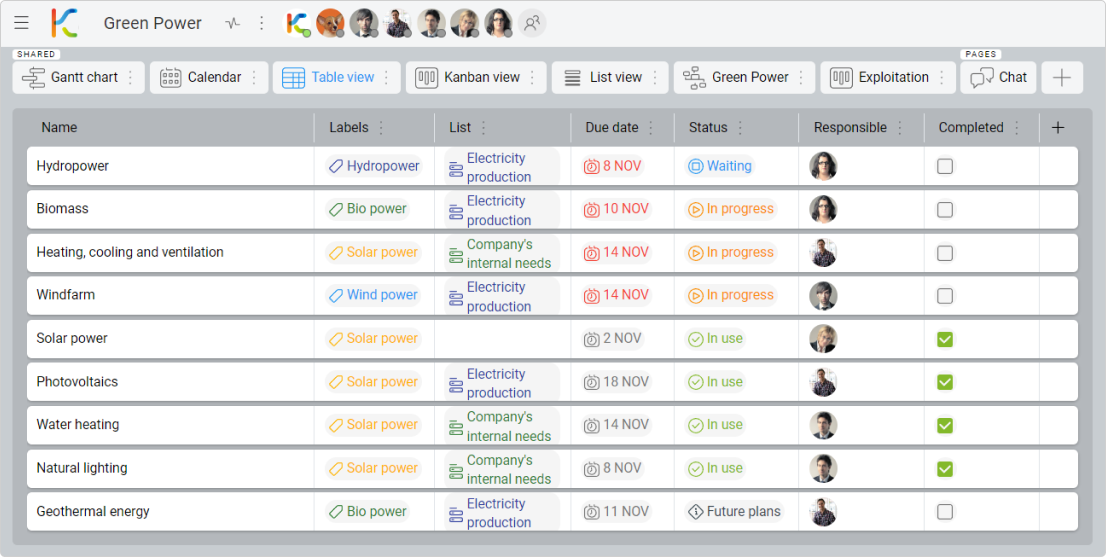
Table View
This post is also available in: Deutsch
A table view is a structured way of presenting information in rows and columns. Tables are useful for organizing and displaying large amounts of data. They can help to make complex information more accessible and easier to understand.
Tables allow users to quickly compare and contrast different pieces of information. It is a perfect way to take advantage of card details. They can be used to create clear and visually appealing presentations of work. In addition, the Table view can be easily sorted and filtered, making it easier to find and analyze specific pieces of information.
Possible scenarios of usage
Table view, which may look similar to a spreadsheet in Excel, can be useful for organizing and analyzing large amounts of data. Here are some potential scenarios in which tables could be useful:
- A human resources department might use a Table view to track employee information, such as contact details, job titles, and performance evaluations. It will help to quickly access and update employee records.
- A finance team could use a table view to track income and expenses or to create budget projections. The Table view could be useful to monitor the company’s financial health for identifying areas for improvement.
- A marketing department could use a Table view to track the performance of different advertising campaigns. It also helps with analyzing the effectiveness of different marketing strategies. The table view could be used to make data-driven decisions about where to allocate marketing resources and to measure the return on investment of different campaigns.
- A product development team could use a Table view to track the progress of different projects and to manage the allocation of resources and personnel. It helps to identify bottlenecks and potential risks and to ensure that projects are completed on time and within budget.
FAQ
Can I create two or more views of the same type?
Yes, you can create two Kanban views, Mind Map views, etc. If you need an additional view due to visual issues and for your convenience, check also how to create a personal view.
Can I export the Table view and import it to Excel?
Yes, follow this instruction to export space views to Excel.
Was this article helpful?
Please, contact us if you have any additional questions.