
-
Learn the Basics
-
- Spaces
- Space Types
- Creating Spaces
- Adding Users to Spaces
- Space Activity Stream
- Following Spaces
- Space Details
- General Space Settings
- Duplicating Spaces
- Renaming Spaces
- Changing the Space Color and Icon
- Removing Users from Spaces
- Closing and Restoring Spaces
- Moving Spaces between Different KanBo Environments
- Deleting Spaces
-
- Creating Cards
- Following Cards
- Scheduling Cards
- Renaming Cards
- Duplicating Cards
- Quick Actions
- Mass Actions
- Copy & Paste
- Archiving Cards
- Adding Cards to MySpace
- Adding Mirror Cards
- Removing Mirror Cards
- Moving Cards between Spaces
- Deleting Cards
- Removing Cards from MySpace
- Hinzufügen von Karten zu "MySpace"
- Entfernen von Karten aus "MySpace"
- Hinzufügen von Status
-
Visualize Work
-
- Space Views
- Creating Space Views
- Personal and Shared Space Views
- Card Grouping
- Filtering Cards
- Display Settings
- Work Progress Calculation
- Grouping Description
- Card Grouping Settings
- Changing the Order of Groupings
- Changing the Order of Space Views
- Deleting Space Views
- Following Card Statuses and Custom Fields
-
-
Collaborate
-
Level Up Your Work
-
Work Securely
-
Integrations
-
- Advanced KanBo Actions in Power Automate
- Creating KanBo Space Attached to Subfolder Created by Power Automate
- Creating Document Folders in Document Libraries Created by KanBo with Power Automate
- Exporting Space Views to Excel
- KanBo and Azure Logic Apps Integration
- Power Automate Integration: Triggers and Actions
- Seamless Import from Microsoft Planner to KanBo
- Synchronizing KanBo with Outlook Calendar
- Using KanBo Outlook App
-
Card Statistics
This post is also available in: Deutsch
Coming soon with the KanBo 3.0 version!
In this article:
Overview
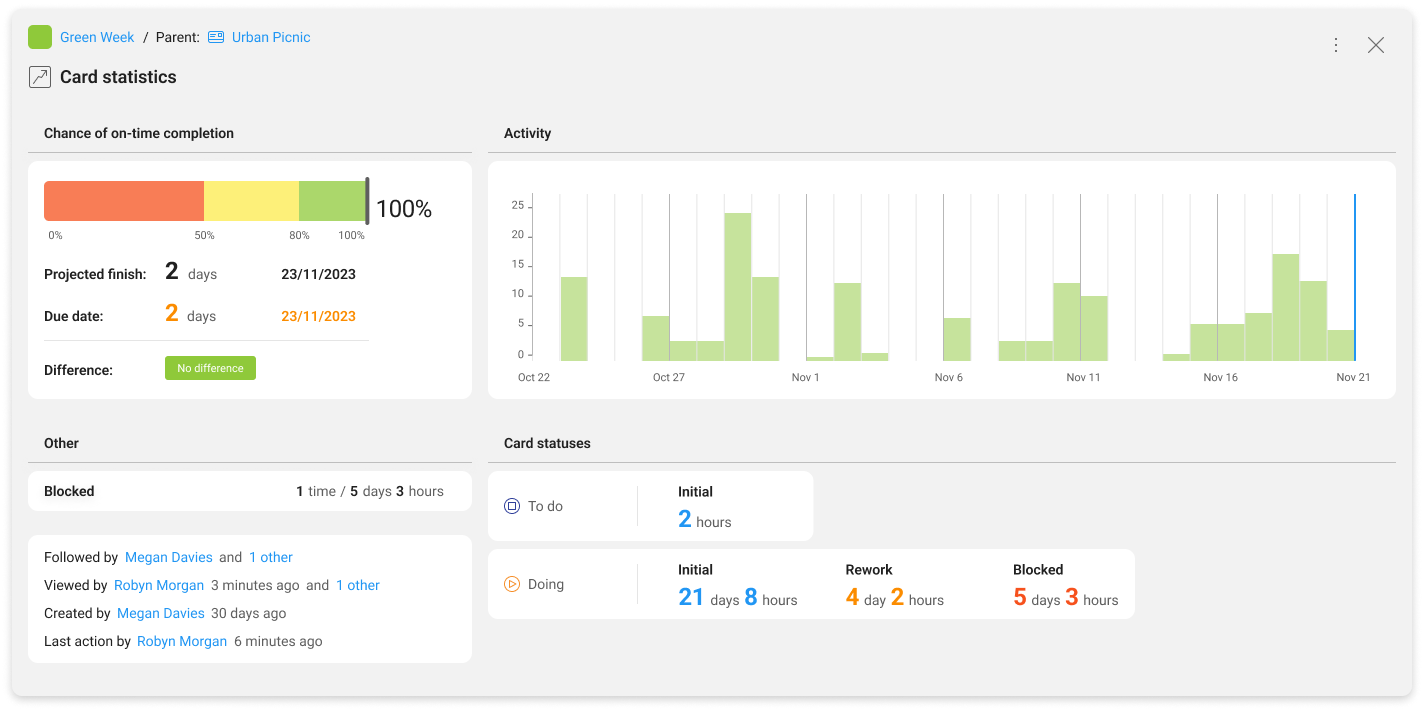
The card statistics feature offers a wealth of analytical insights to help users gain a comprehensive understanding of their card realization process. It provides a visual representation of a card’s lifecycle.
Every activity within the card, from a completed to-do list item to a change in the card’s status, is recorded. Based on this, predictions for card completion are calculated.
Follow the Urban Picnic Design card example to understand the new feature.
Chance of on-time completion
The first section that strikes our eye is the chance of on-time completion field. The bar graph shows the probability that this card will be completed before (or by) its scheduled due date.
Calculation are based on:
- the historical data of the card template
- the card’s status
- the card’s effort (allocation)
- the number of days remaining until the card’s scheduled completion.

The results are color-coded according to the following percentages:
- Red: 0% – 49%,
- Yellow: 50% – 79%,
- Green: 80% – 100%
Card time
When the card is completed, a card time section appears in place of the chance of on-time completion graph. Here you can track the entire life of the card.
Lead time refers to the total time from card creation to completion. It helps you understand how long it takes for cards to move through your workflow from start to finish.
Lead time = Reaction time + Cycle time
In other words it is a time to go from ![]() Not started to
Not started to ![]() Completed status role.
Completed status role.
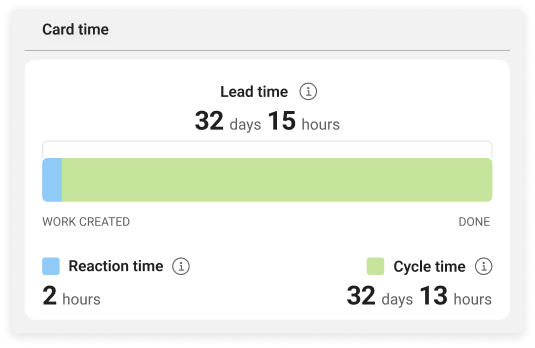
Reaction time measures the time between card creation and when work begins on it. This marked with blue color metric helps you gauge how quickly your team responds to new tasks and ensures that work is initiated promptly after card creation.
It is a time to go from ![]() Not started to
Not started to ![]() In progress status role.
In progress status role.
Cycle time, on the other hand, measures the total time it takes from when work begins on a card until its completion. This metric provides you with insights into how long it takes for your team to complete tasks after they have started working on them.
It is a time to go from ![]() In progress to
In progress to ![]() Completed status role.
Completed status role.
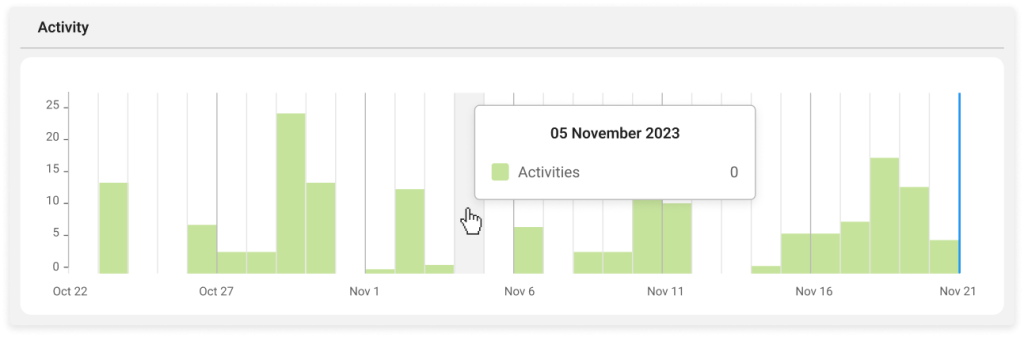
Activity
The activities performed each day in the card are presented in the form of a bar chart. You can track the number of card activities occurring in each time frame. Hover over a column to view the exact number of activities.
Card statuses
You can check the exact time the card has spent in each card status with hourly accuracy.
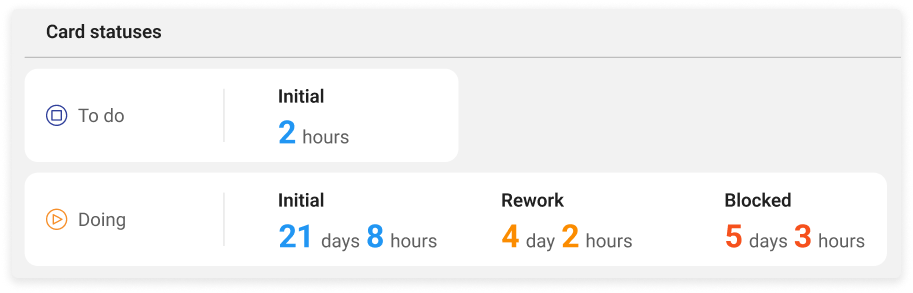
Any difficulties, such as card blockers, related to its completion will be noted.
KanBo recognizes status changes of less than 5 minutes as "accidental".
Other information
At the bottom of the card statistics pop-up, you will find a summary of the people associated with the card. You can see who is viewing it, who created it and when, as well as the last action performed.
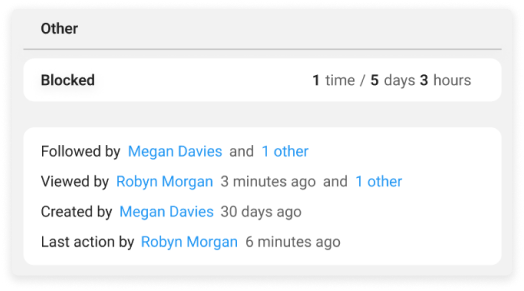
An additional field shows the number of times the card was blocked and the total time it was blocked.
Access to card statistics
Every space user can see the card statistics.
Card statistics are not available on cards with the ![]() Information status role.
Information status role.
To open the card statistics window:
- Open the space.
- Enter the card.
- Press More (the three-dots button).
- Select
 Card statistics.
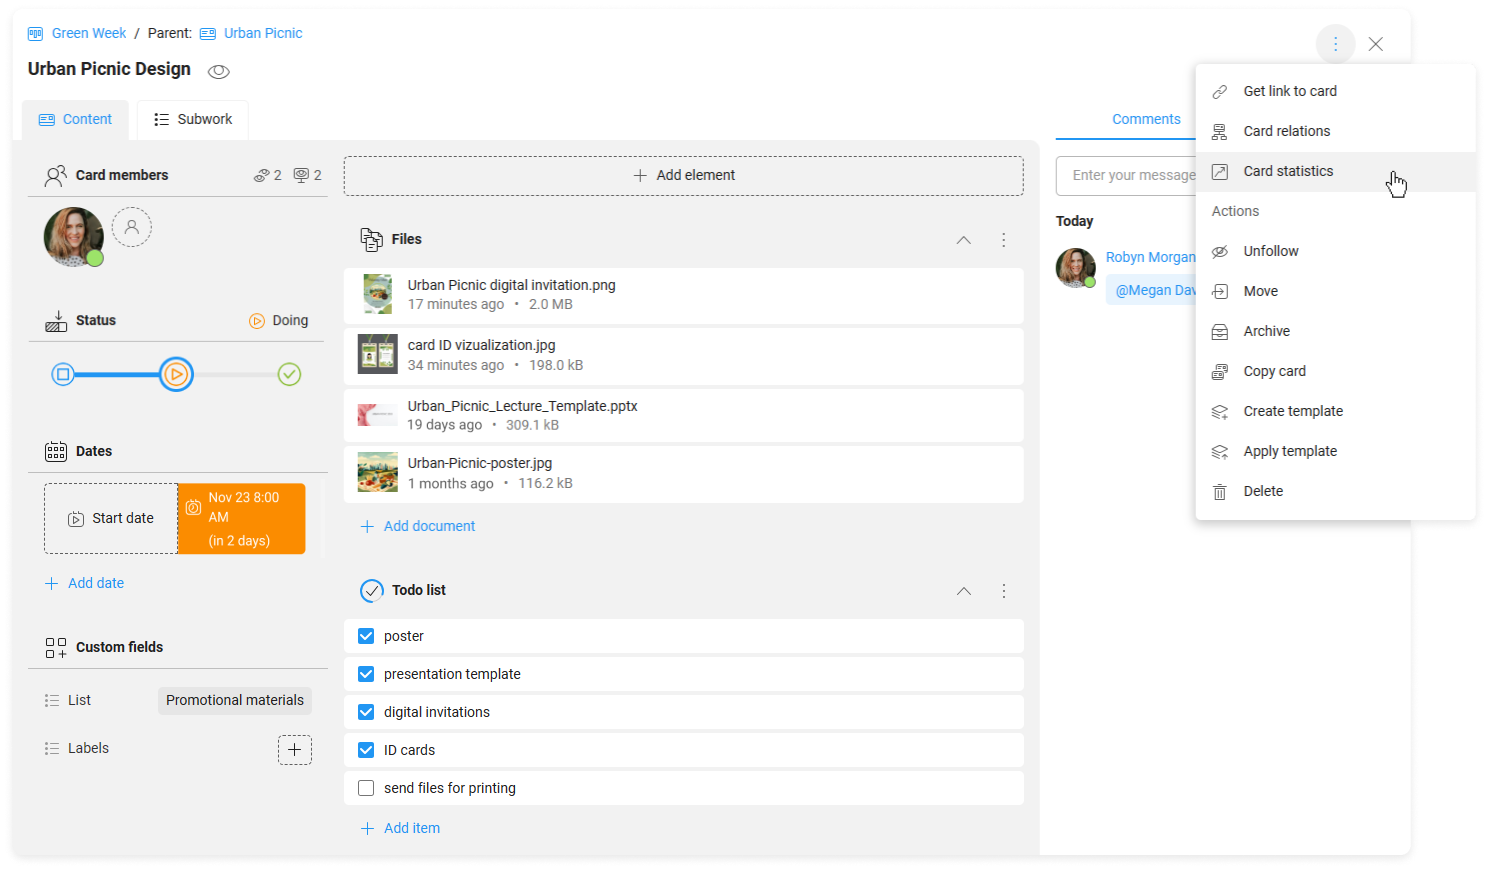
Card statistics will open in a form of a pop-up window.
See more tools for monitoring your work:
FAQ
Why can't I see the statistics in my card?
Card statistics are not available on cards with the ![]() Information status role. If you can’t see the card statistics icon on a card with other status roles, make sure that the Elastic Search is installed.
Information status role. If you can’t see the card statistics icon on a card with other status roles, make sure that the Elastic Search is installed.
How can I see card realization progress more precisely?
Every card front has a circle around the status icon, which shows the work calculation progress. Hover over the status icon to see the percentage completion rate.
Was this article helpful?
Please, contact us if you have any additional questions.