
-
Learn the Basics
-
- Creating Cards
- Changing Card Statuses
- Following Cards
- Scheduling Cards
- Renaming Cards
- Duplicating Cards
- Quick Actions
- Mass Actions
- Copy & Paste
- Creating Card Statuses
- Changing the Default Card Status
- Changing the Order of Card Statuses
- Deleting Card Statuses
- Moving Cards between Spaces
- Archiving Cards
- Unarchiving Cards
- Deleting Cards
- Creating Card Blockers
- Managing Card Blockers
- Adding Cards to MySpace
- Hinzufügen von Karten zu "MySpace"
- Removing Cards from MySpace
- Entfernen von Karten aus "MySpace"
- Adding Mirror Cards
- Removing Mirror Cards
-
- Documents in KanBo
- Card Documents
- Uploading or Creating Documents in Cards
- Attaching and Detaching Documents in Cards
- Space Documents
- Document References
- Document Sources
- Downloading Documents
- Editing Documents
- Editing Documents in Browser
- Editing Documents in Office Applications
- Renaming Documents
- Deleting Documents
-
Visualize Work
-
- Space Views
- Creating Space Views
- Personal and Shared Space Views
- Card Grouping
- Filtering Cards
- Display Settings
- Work Progress Calculation
- Grouping Description
- Card Grouping Settings
- Changing the Order of Groupings
- Changing the Order of Space Views
- Deleting Space Views
- Following Card Statuses and Custom Fields
-
-
Collaborate
-
Level Up Your Work
-
Work Securely
-
Integrations
-
- Advanced KanBo Actions in Power Automate
- Creating KanBo Space Attached to Subfolder Created by Power Automate
- Creating Document Folders in Document Libraries Created by KanBo with Power Automate
- Exporting Space Views to Excel
- KanBo and Azure Logic Apps Integration
- Power Automate Integration: Triggers and Actions
- Seamless Import from Microsoft Planner to KanBo
- Synchronizing KanBo with Outlook Calendar
- Using KanBo Outlook App
-
Work Progress Calculation
This post is also available in: Deutsch
The work progress calculation tool allows you to keep track of your workflow. The indicators on each card and grouping list summarize the work progress, assuming that all cards require similar effort to complete.
Card progress indicator
The counter around the card status icon shows the card realization progress. When a card or its part (to-do list item or subcard) is completed, you will see that the counter indicator will begin to fill.

Grouping progress indicator
The circle around the icon in the name bar of the grouping list represents the percentage of work done for each grouping. To calculate the progress of work in a particular grouping, the progress of the cards belonging to it is summed up.

Example
The best way to understand it is to use an example.
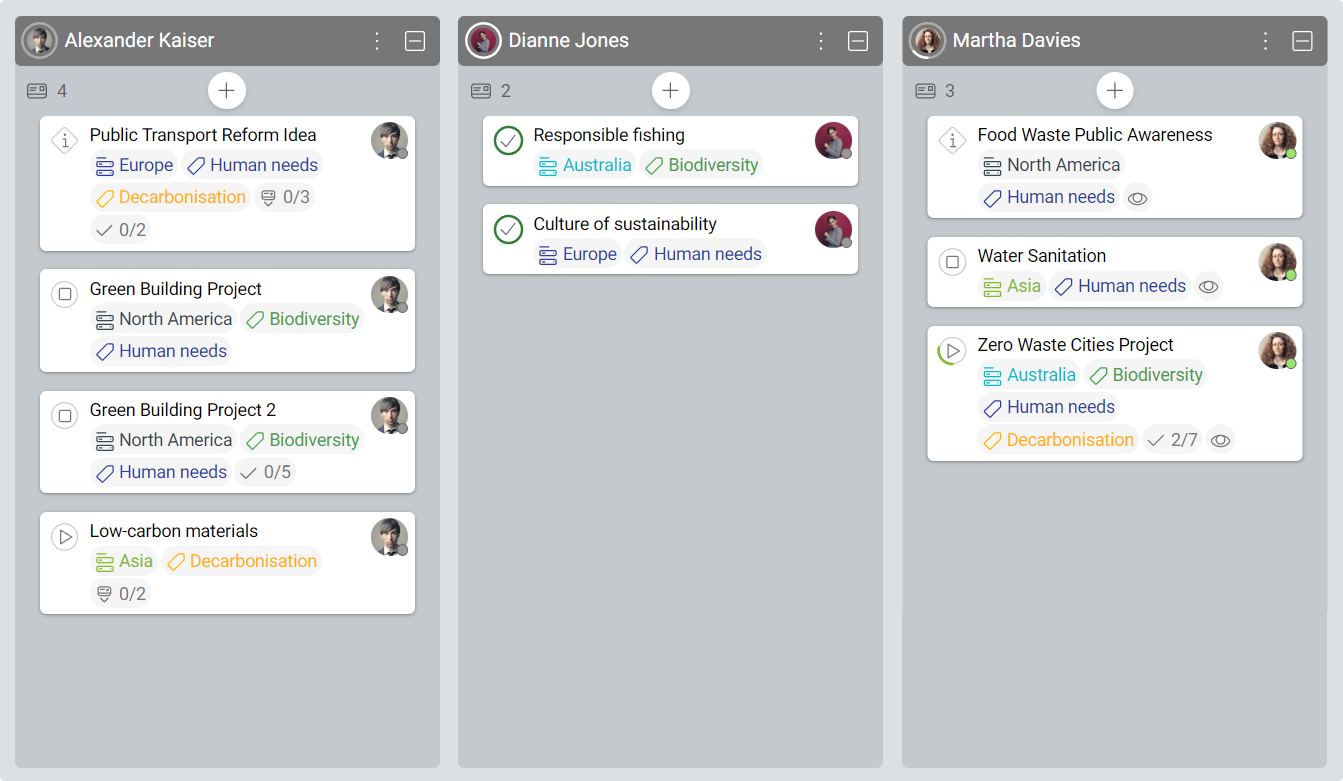
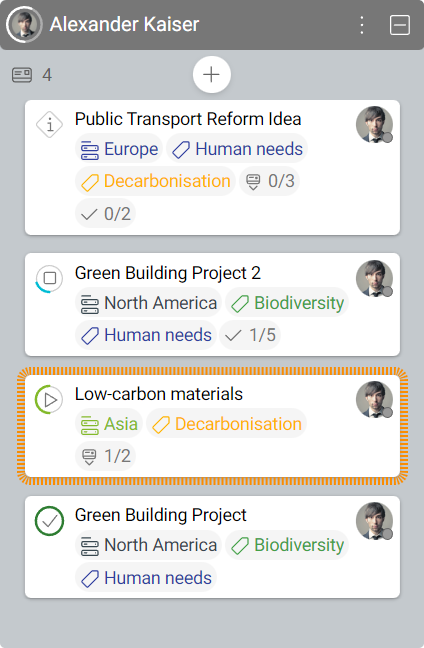
There is a space with card grouping by user option selected. The view shows you one grouping for each user. Let’s look at the first grouping.
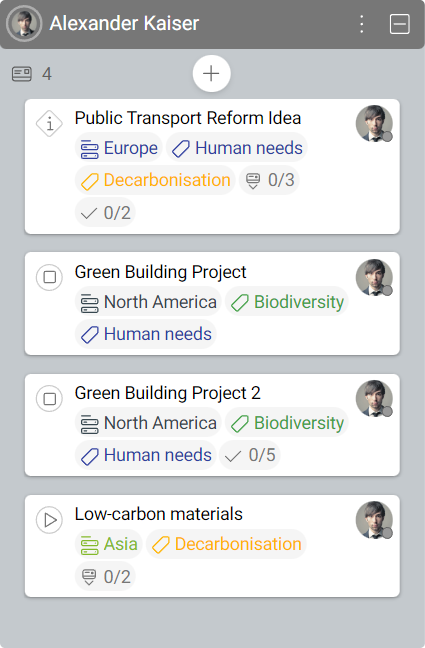
-
Public Transport Reform Idea,
2 to-do items and 3 subcards, status – Information -
Green Building Project,
0 to-do items and 0 subcards, status – Not started -
Green Building Project 2,
5 to-do items and 0 subcards, status – Not started -
Low-carbon materials,
0 to-do items and 2 subcards, status – In progress
Here are some example cards:
Now you can see what will happen when we start to complete these cards or their subcards and to-do items.
Card 1
Public Transport Reform Idea
This card has Information status. It means that it will not be included in the work progress calculation.
It does not matter what happened with the subcards and to-do items on that card. As you can see, one of the to-do items was completed but it makes no changes to the grouping.
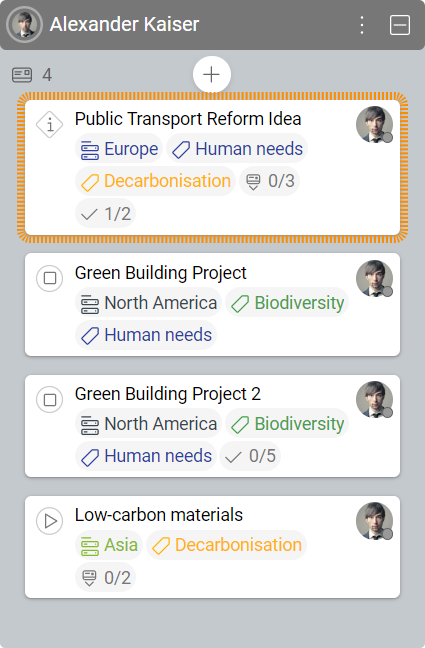
Cards with Information status are not taken into account in the work progress calculation.
Card 2
Green Building Project
This card has no to-do items or subcards. Its initial status was Not started. After changing the status to Completed:
- the grouping will show a 33% bold circle around the user’s avatar
- the card will show a 100% bold circle around the status icon
Why 33%? We have three cards taken into account. 100% means all work is done.
100% / 3 = 33 % per card
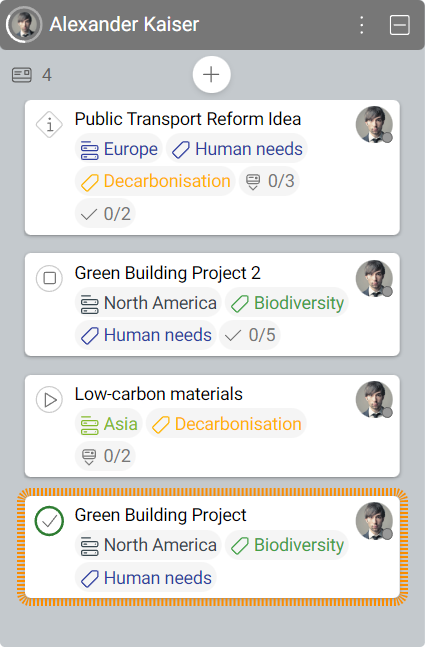
Notice that the completed card moves to the bottom of the user grouping.
Card 3
Green Building Project 2
33% of the whole card is split between 5 to-do items: 33% / 5 = 6.6% per to-do item.
Completing each do-do item will add 6.6% to the percentage counter at the top of the grouping.
Now you can see one of five to-do items completed and there are:
- 39.6% bold circle around the user’s avatar
- 20% bold circle around the card status icon

If you set the card status to completed before all to-do items or subcards are marked as completed, the algorithm will ignore them. The percentage counter at the top of the grouping will add the whole card portion of completion which is 33% in this scenario.
Card 4
Low-carbon materials
33% are split between 2 subcards:
33% / 2 = 16.5%
If one subcard is completed, KanBo will add 16.5% to the percentage counter at the top of the grouping.
One of the two subcards is completed, that is why we have:
- 56.1% bold circle around the user’s avatar
- 50% bold circle around card status icon
Some final words:
We are aware that this approach is not always right since treating a to-do item similar to a subcard is mostly wrong, but we intended to give you a rough estimate.
Please note that this works for groupings in any type of the available grouping views provided by KanBo.
FAQ
What is the purpose of card statuses?
Card status is a feature that shows the progress of a card realization and indicates what stage your tasks are in.
How can I see card realization progress more precisely?
Every card front has a circle around the status icon, which shows the work calculation progress.
What is the role of the Information status?
The Information status is used for cards that contain important information but are not executable. It does not represent the progress of completing a card.
How do I change the status of a card?
You can change the status of a card by dragging and dropping it to a different status grouping, by selecting a new status in the card details section, or by using the Quick Actions menu.
What exactly affects the card progress indicator?
A card can symbolize a simple task or be divided into smaller steps to perform. These steps can be represented by the to-do list’s items or subcards in child card groups.
Was this article helpful?
Please, contact us if you have any additional questions.