
-
Learn the Basics
-
- Creating Cards
- Changing Card Statuses
- Following Cards
- Scheduling Cards
- Renaming Cards
- Duplicating Cards
- Quick Actions
- Mass Actions
- Copy & Paste
- Creating Card Statuses
- Changing the Default Card Status
- Changing the Order of Card Statuses
- Deleting Card Statuses
- Moving Cards between Spaces
- Archiving Cards
- Unarchiving Cards
- Deleting Cards
- Creating Card Blockers
- Managing Card Blockers
- Adding Cards to MySpace
- Hinzufügen von Karten zu "MySpace"
- Removing Cards from MySpace
- Entfernen von Karten aus "MySpace"
- Adding Mirror Cards
- Removing Mirror Cards
-
- Documents in KanBo
- Card Documents
- Uploading or Creating Documents in Cards
- Attaching and Detaching Documents in Cards
- Space Documents
- Document References
- Document Sources
- Downloading Documents
- Editing Documents
- Editing Documents in Browser
- Editing Documents in Office Applications
- Renaming Documents
- Deleting Documents
-
Visualize Work
-
- Space Views
- Creating Space Views
- Personal and Shared Space Views
- Card Grouping
- Filtering Cards
- Display Settings
- Work Progress Calculation
- Grouping Description
- Card Grouping Settings
- Changing the Order of Groupings
- Changing the Order of Space Views
- Deleting Space Views
- Following Card Statuses and Custom Fields
-
-
Collaborate
-
Level Up Your Work
-
Work Securely
-
Integrations
-
- Advanced KanBo Actions in Power Automate
- Creating KanBo Space Attached to Subfolder Created by Power Automate
- Creating Document Folders in Document Libraries Created by KanBo with Power Automate
- Exporting Space Views to Excel
- KanBo and Azure Logic Apps Integration
- Power Automate Integration: Triggers and Actions
- Seamless Import from Microsoft Planner to KanBo
- Synchronizing KanBo with Outlook Calendar
- Using KanBo Outlook App
-
Forecast Chart
This post is also available in: Deutsch
Coming soon with the KanBo 3.0 version!
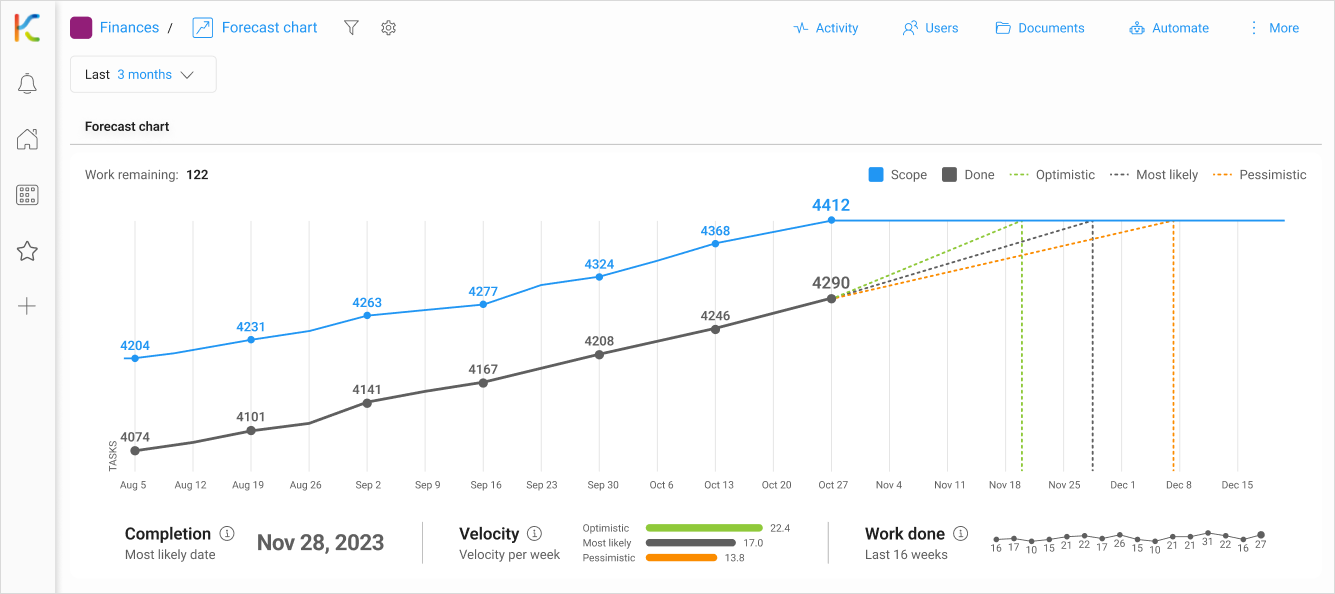
Forecast Chart in KanBo allows you to track the progress of your work and make data-driven forecasts. This chart provides valuable insights into the completion of your project, helping you understand how much work has been done and how much is left.
Predict your team's work progress
The Forecast Chart consists of two lines: a blue line representing the project scope, and a grey line representing the work that has been completed. As time progresses, the grey line moves closer to the blue line, indicating the remaining tasks.
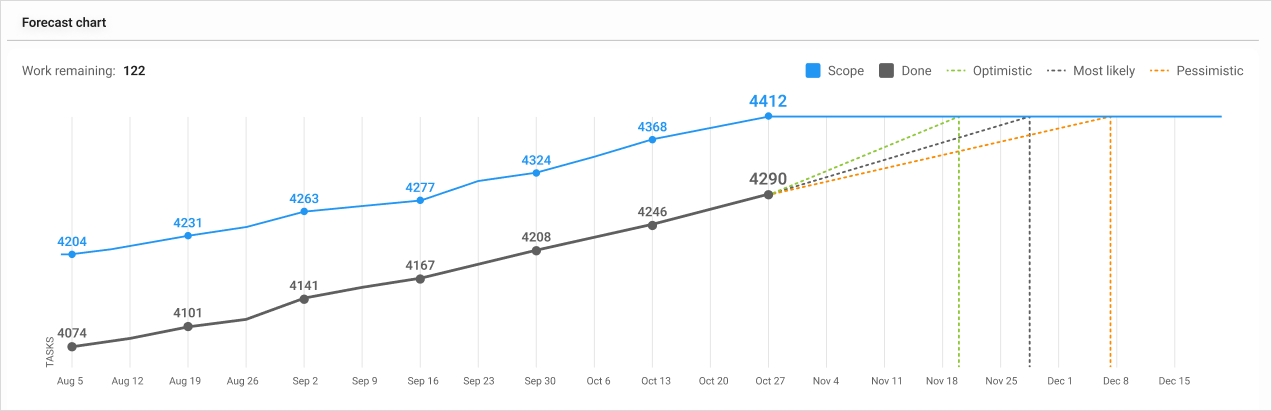
Blue line – project scope
Grey line – cards done
Lines are drawn through the number of cards completed.
Compareing different scenarios for completion
Three scenarios are generated based on the team’s historical data. The Optimistic scenario represents the 80th percentile of completed work per week, while the Most likely scenario represents the median week. The Pessimistic scenario represents the 20th percentile of completed work per week.
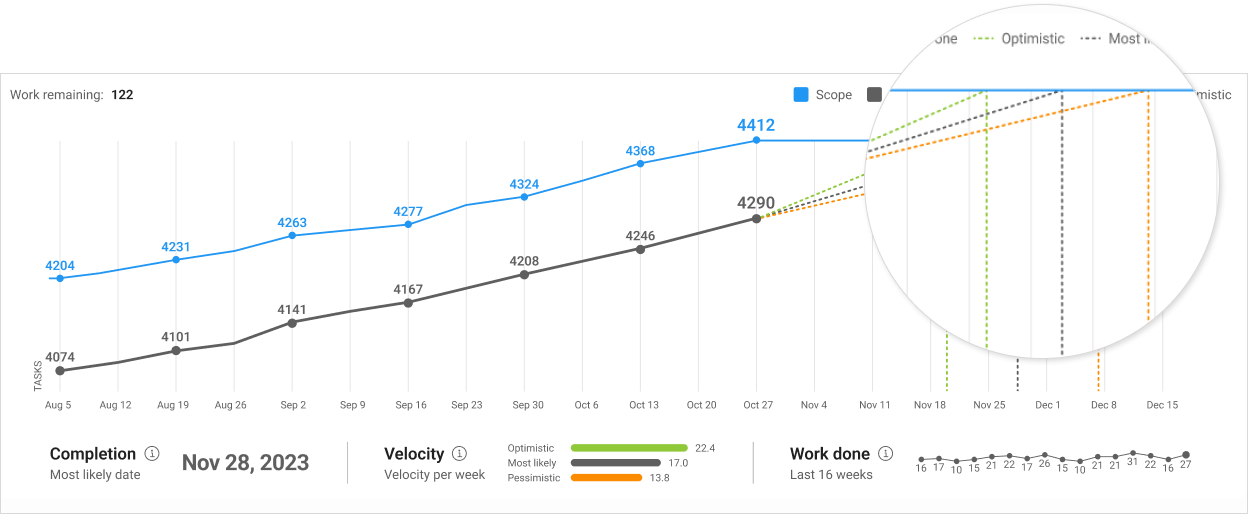
Three scenarios are are outlined with dashed lines of specific colours:
- Optimistic – 80%
- Most likely – 50%
- Pessimistic – 20%
Data-driven forecasting
In addition to these scenarios, the Forecast Chart also provides data-driven forecasts based on your team’s historical velocity. The optimistic forecast expects the team to complete more work than in 80% of the past weeks, while the most likely forecast aligns with the median week. The pessimistic forecast assumes the team will only complete as much work as in 20% of the past weeks.
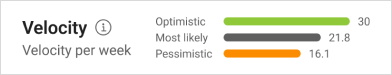
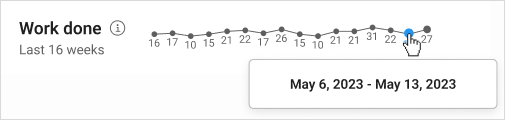
The velocity trend on the bottom right of the chart shows the number of completed tasks or estimates per calendar week for the past 16 weeks. This trend helps you understand the team’s productivity and track their progress over time.
Customization
You can customize the Forecast Chart settings to use either the full velocity (total amount of work completed) or the scope-specific velocity (work completed for a specific filter, such as a label or work scope). This allows you to gain insights into specific areas of your project and make more targeted forecasts.
It’s important to note that the Forecast Chart is updated regularly to provide real-time data. The scope, completed tasks, and forecasts are updated hourly, while a new data point is added to the velocity chart once per calendar week.
Cards with the ![]() information status are not included in the Forecast Chart view.
information status are not included in the Forecast Chart view.
Creating Forecast Chart view
Only space owners can create shared space views, but any space user can create personal space views.
To create a Forecast Chart view:
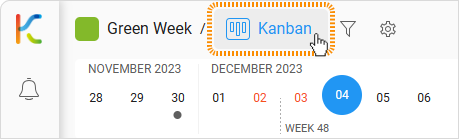
- Open the space.
- Click on the current space view name.
- Click on the + Add view button.
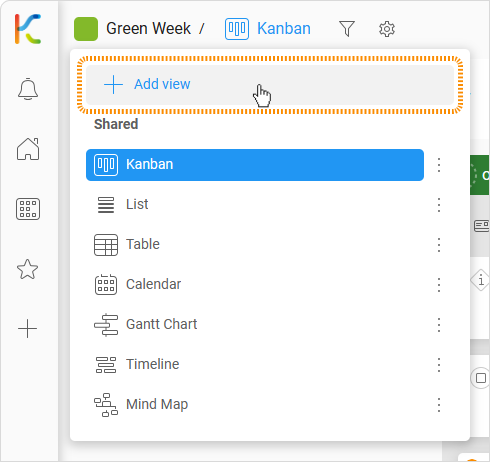
- Select the Forecast Chart option.
- Enter a name.
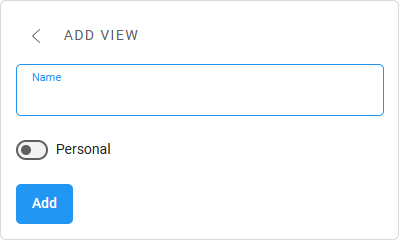
- Click Add to confirm.
Renaming Forecast Chart view
You must be the space owner to rename the view.
The name of every view can be easily changed with the view settings.
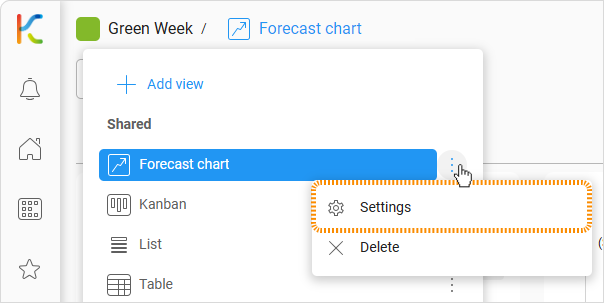
To rename a Forecast Chart:
- Open the space.
- Click on the current space view button on the top bar.
- Click on the three-dot menu button next to the Forecast Chart view.
- Select
 Settings.
- Click on the name field.
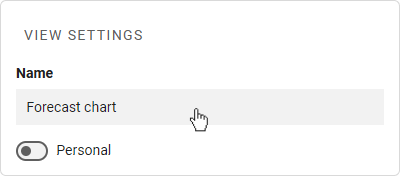
- Enter the new name.
- Click on the Save button.
Deleting Forecast Chart view
You must be a space owner to delete the view.
To delete a Forecast Chart view:
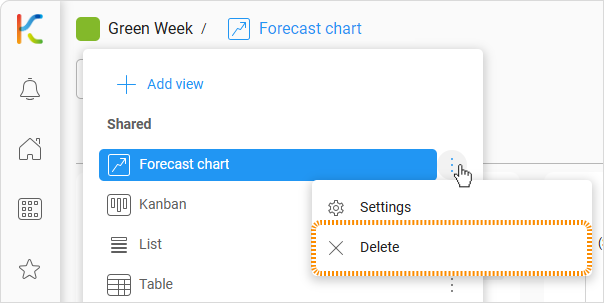
- Open the space.
- Click on the current space view button on the top bar.
- Click on the three-dot menu button next to the Forecast Chart view.
- Select the Delete option.
If the space has only one view, you cannot delete it.
Was this article helpful?
Please, contact us if you have any additional questions.