
-
Learn the Basics
-
- Spaces
- Space Types
- Creating Spaces
- Adding Users to Spaces
- Space Activity Stream
- Following Spaces
- Space Details
- General Space Settings
- Duplicating Spaces
- Renaming Spaces
- Changing the Space Color and Icon
- Removing Users from Spaces
- Closing and Restoring Spaces
- Moving Spaces between Different KanBo Environments
- Deleting Spaces
-
- Creating Cards
- Following Cards
- Scheduling Cards
- Renaming Cards
- Duplicating Cards
- Quick Actions
- Mass Actions
- Copy & Paste
- Archiving Cards
- Adding Cards to MySpace
- Adding Mirror Cards
- Removing Mirror Cards
- Moving Cards between Spaces
- Deleting Cards
- Removing Cards from MySpace
- Hinzufügen von Karten zu "MySpace"
- Entfernen von Karten aus "MySpace"
- Hinzufügen von Status
-
Visualize Work
-
- Space Views
- Creating Space Views
- Personal and Shared Space Views
- Card Grouping
- Filtering Cards
- Display Settings
- Work Progress Calculation
- Grouping Description
- Card Grouping Settings
- Changing the Order of Groupings
- Changing the Order of Space Views
- Deleting Space Views
- Following Card Statuses and Custom Fields
-
-
Collaborate
-
Level Up Your Work
-
Work Securely
-
Integrations
-
- Advanced KanBo Actions in Power Automate
- Creating KanBo Space Attached to Subfolder Created by Power Automate
- Creating Document Folders in Document Libraries Created by KanBo with Power Automate
- Exporting Space Views to Excel
- KanBo and Azure Logic Apps Integration
- Power Automate Integration: Triggers and Actions
- Seamless Import from Microsoft Planner to KanBo
- Synchronizing KanBo with Outlook Calendar
- Using KanBo Outlook App
-
Gantt Chart View
This post is also available in: Deutsch
A Gantt Chart is an essential tool for organizing and tracking projects effectively. One of the primary benefits of a Gantt Chart is that it provides a clear overview of the project with its simple yet powerful visual representation of tasks and their timelines. This allows you to allocate resources more efficiently, identify potential delays, and keep the project on track.
Another advantage of using a Gantt chart is that it allows team members to see the project’s progress in real-time, ensuring everyone is aware of what needs to be done and by when. This can help promote transparency, accountability, and teamwork among project members. In addition, Gantt charts can be used to identify potential bottlenecks in the project timeline and to adjust the schedule accordingly. This can help to minimize project delays and ensure that deadlines are met.
Gantt Chart view in KanBo
A Gantt Chart view is a bar chart that shows you a project schedule in a highly visual manner. With this time-dependent functionality, you can set a visual view for all cards which are a part of the space. The cards will be seen in a timeframe view and it’s easy to see their conditions in the present day.
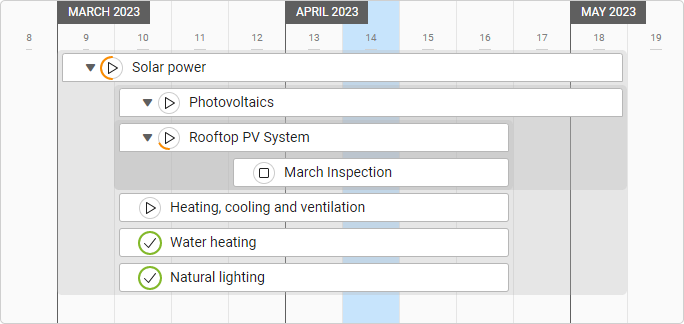
This is the perfect tool for tracking cards with their relations and even creating new connections between them. With the Gantt Chart view you can focus on time dependencies between cards, as time is the essence of this view. The parent and child relation is shown in the example above.
Cards are sorted chronologically. When you change the start date of the card it can be relocated on the chart.
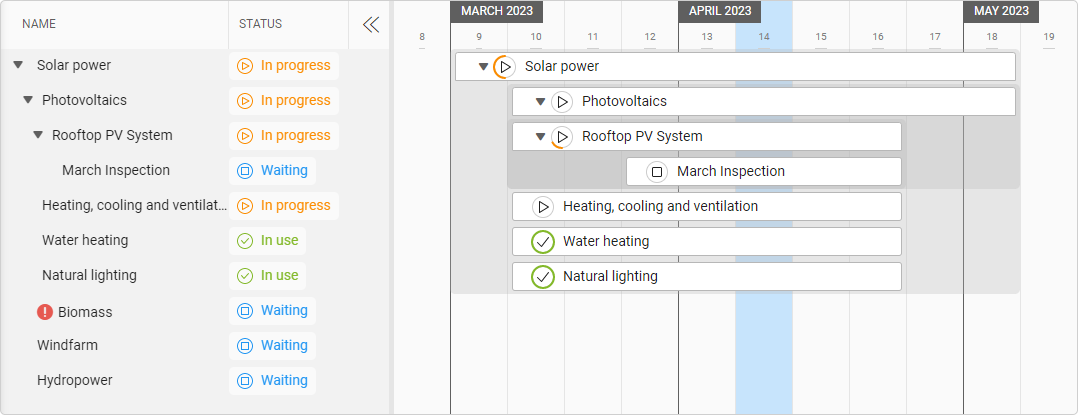
Informational section
On the left side, you can find the section with card names and other card detail in columns. Every row is located at the same high as the card on the chart. Add or remove columns using Display Settings.
Current time bar
The blue vertical bar in the center will highlight the present time unit (day/week/month/year etc.). This makes it easier for you to inspect the timeframes of card bars against the current date.
There is a monthly time scale in the example above.
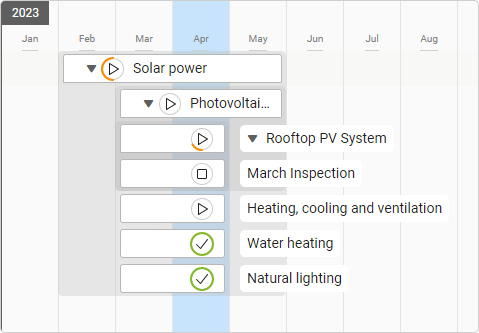
Time scale
Depending on the project’s needs, you can set the appropriate time scale. Select a day, week, month, quarter, half-year, or year time range. The time scale drop-down menu is located on the top right part of the view.

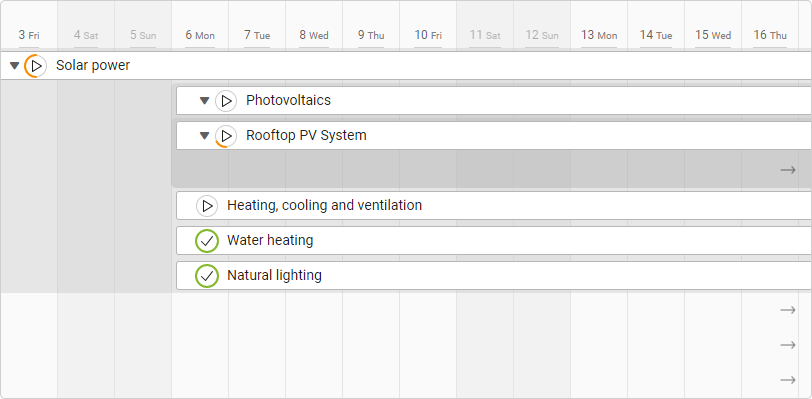
When cards do not fit in the view, small arrows appear along the edges of the window. You can click on it to move to the card.
Look at the other examples in this article and see the differences between time scale options.
FAQ
What is a Gantt chart?
A Gantt chart is a visual tool for organizing and tracking projects by displaying tasks and timelines in a bar chart format.
Are there more views with card relations highlighted?
Yes, you can observe card relations in the Mind Map view too. There is also an option to expand child cards in the Kanban view and List view.
How can the Gantt chart view be customized in KanBo?
The Gantt Chart view in KanBo can be customized by adding or removing columns in the informational section, selecting an appropriate time scale, changing the row height, or filtering cards.
Was this article helpful?
Please, contact us if you have any additional questions.