
-
Learn the Basics
-
- Creating Cards
- Changing Card Statuses
- Following Cards
- Scheduling Cards
- Renaming Cards
- Duplicating Cards
- Quick Actions
- Mass Actions
- Copy & Paste
- Creating Card Statuses
- Changing the Default Card Status
- Changing the Order of Card Statuses
- Deleting Card Statuses
- Moving Cards between Spaces
- Archiving Cards
- Unarchiving Cards
- Deleting Cards
- Creating Card Blockers
- Managing Card Blockers
- Adding Cards to MySpace
- Hinzufügen von Karten zu "MySpace"
- Removing Cards from MySpace
- Entfernen von Karten aus "MySpace"
- Adding Mirror Cards
- Removing Mirror Cards
-
- Documents in KanBo
- Card Documents
- Uploading or Creating Documents in Cards
- Attaching and Detaching Documents in Cards
- Space Documents
- Document References
- Document Sources
- Downloading Documents
- Editing Documents
- Editing Documents in Browser
- Editing Documents in Office Applications
- Renaming Documents
- Deleting Documents
-
Visualize Work
-
- Space Views
- Creating Space Views
- Personal and Shared Space Views
- Card Grouping
- Filtering Cards
- Display Settings
- Work Progress Calculation
- Grouping Description
- Card Grouping Settings
- Changing the Order of Groupings
- Changing the Order of Space Views
- Deleting Space Views
- Following Card Statuses and Custom Fields
-
-
Collaborate
-
Level Up Your Work
-
Work Securely
-
Integrations
-
- Advanced KanBo Actions in Power Automate
- Creating KanBo Space Attached to Subfolder Created by Power Automate
- Creating Document Folders in Document Libraries Created by KanBo with Power Automate
- Exporting Space Views to Excel
- KanBo and Azure Logic Apps Integration
- Power Automate Integration: Triggers and Actions
- Seamless Import from Microsoft Planner to KanBo
- Synchronizing KanBo with Outlook Calendar
- Using KanBo Outlook App
-
Time Chart
This post is also available in: Deutsch
Coming soon with the KanBo 3.0 version!
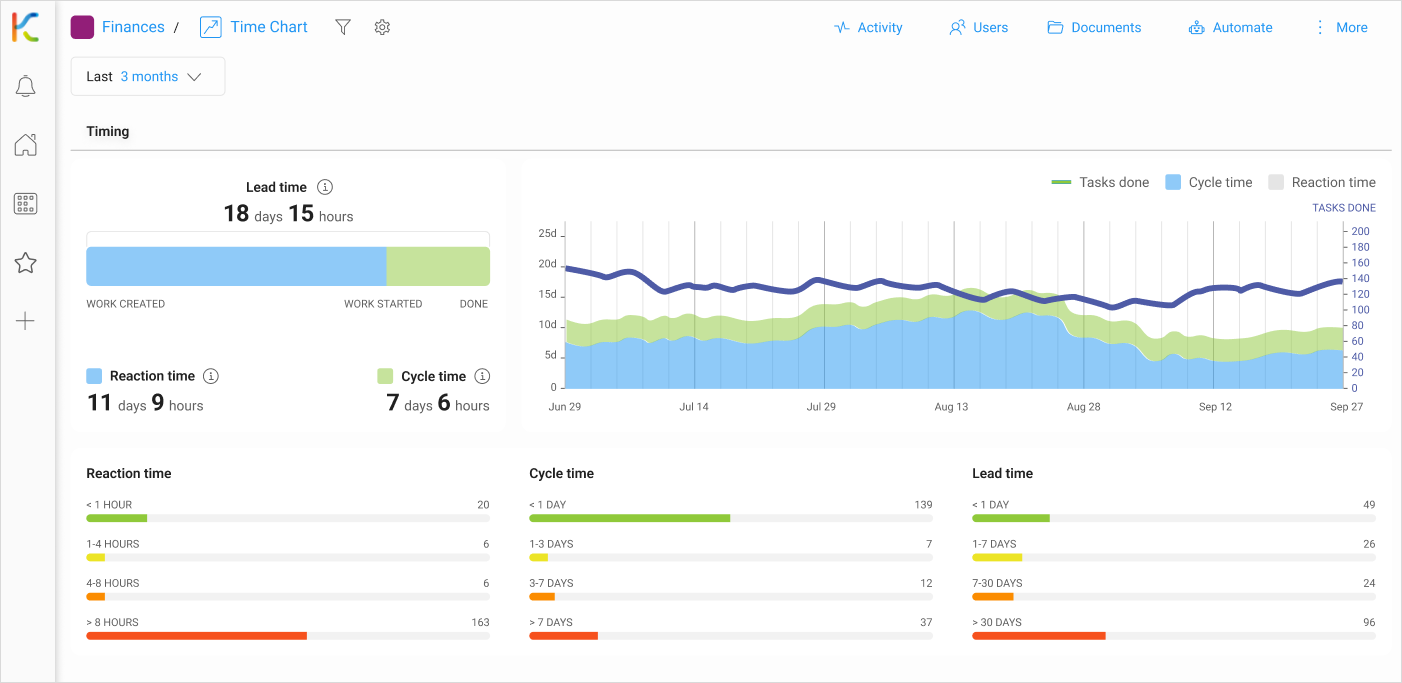
Time Chart is a space view that allows you to gain insights into the time it takes to complete tasks in your workflow. It provides you with valuable information about lead time, reaction time, and cycle time, which are essential metrics for measuring the efficiency of your processes.
Time parameters
There are 3 important parameters you can follow:
- Lead time refers to the total time taken from the creation of a card until its completion.
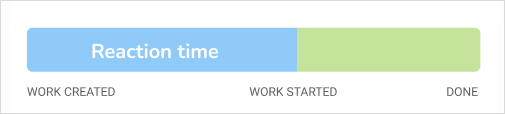
- Reaction time measures the time between card creation and when work begins on it.
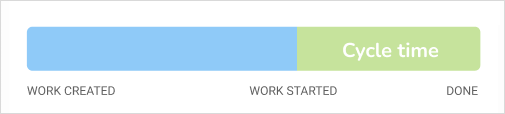
- Cycle time, on the other hand, measures the total time it takes from when work begins on a card until its completion.
Lead time
Lead time refers to the total time taken from the creation of a card until its completion. It helps you understand how long it takes for cards to move through your workflow from start to finish. By tracking lead time, you can identify areas where delays occur and take steps to optimize your workflow.
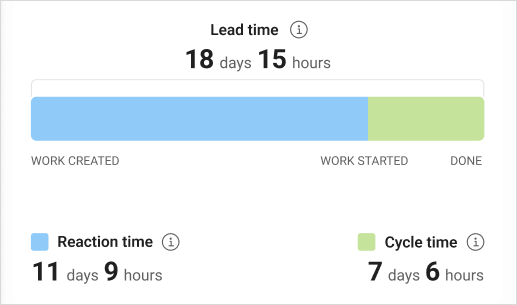
Lead time = Reaction time + Cycle time
In other words it is a time to go from ![]() Not started to
Not started to ![]() Completed status role.
Completed status role.
Cards with the ![]() Information status are not included in the Time Chart view.
Information status are not included in the Time Chart view.
Reaction time
Reaction time measures the time between card creation and when work begins on it. This marked with blue color metric helps you gauge how quickly your team responds to new tasks and ensures that work is initiated promptly after card creation. By monitoring reaction time, you can identify any bottlenecks or delays in task initiation and make necessary adjustments to improve efficiency.
Cycle time
Cycle time, on the other hand, measures the total time it takes from when work begins on a card until its completion. This metric provides you with insights into how long it takes for your team to complete tasks after they have started working on them. By analyzing cycle time, you can identify any factors or steps that may be causing delays or slowing down the completion of cards.
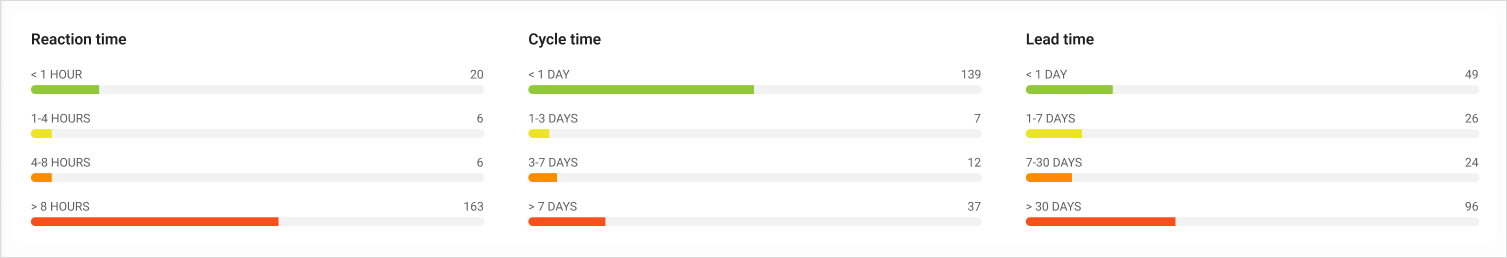
Analyze your workflow
Time Chart view also allows you to break down cycle time and analyze the distribution of cards based on their resolution time. This breakdown provides a clear picture of how long tasks typically take to be resolved, which can help you set realistic expectations for card completion and identify any outliers or patterns.
Time range
First of all, select the time period you want to analyze by choosing one of the options in the Time range drop-down menu.
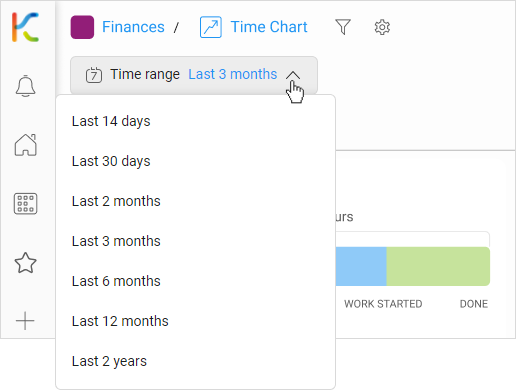
Now you will see the results of the analysis adequate for the selected time interval.
Reading charts
On the left is a graph showing the progression of tasks within the selected time range.
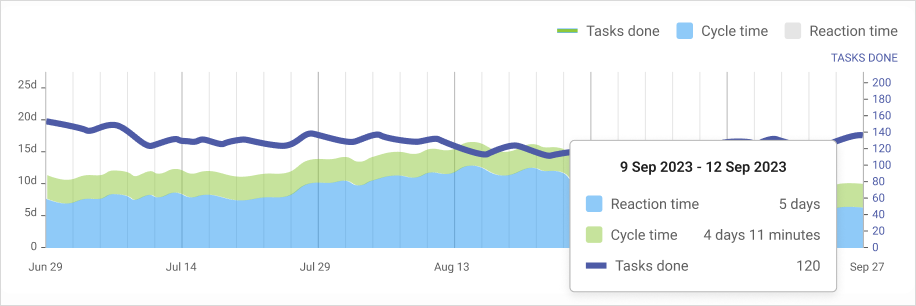
When you hover over a specific time period column, you can view the details – the average reaction time, cycle time and the number of tasks done.
When you click on that chart, it will take you to another view, where you can analyze how long the cards were in each card status. This chart is more personalized to your space and its specific workflow.
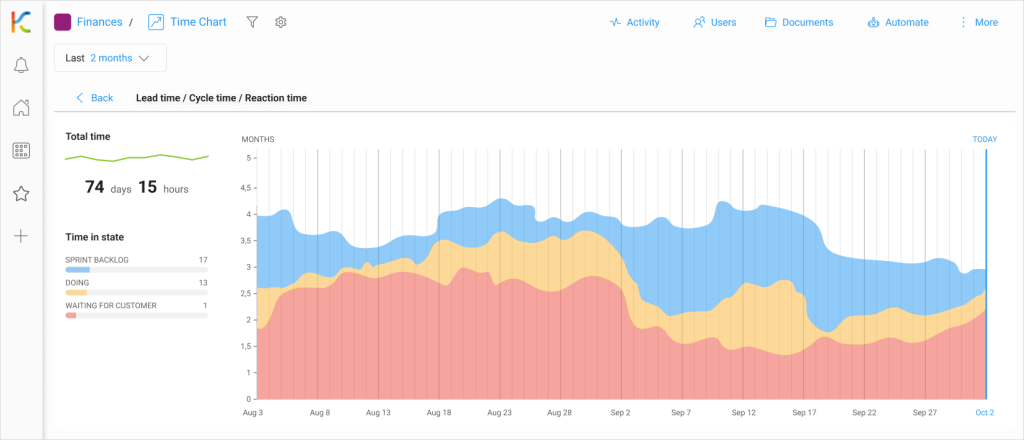
Additionally, the Time Chart enables you to visualize how long each workflow step takes in your process. By viewing the average time cards spend in each workflow state before completion, you can identify any steps that are causing delays or taking longer than expected. This information can help you optimize your workflow and streamline the process by addressing any bottlenecks or inefficiencies.
By monitoring lead time, reaction time, and cycle time, you can identify areas for improvement and make data-driven decisions to enhance efficiency and productivity in your work processes.
Creating Time Chart view
Only space owners can create shared space views, but any space user can create personal space views.
To create a Time Chart view:
- Open the space.
- Click on the current space view name.
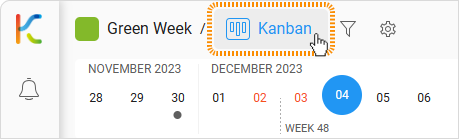
- Click on the + Add view button.
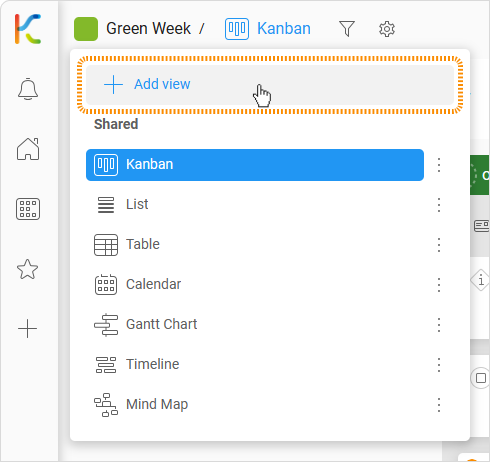
- Select the Time Chart option.
- Enter a name.
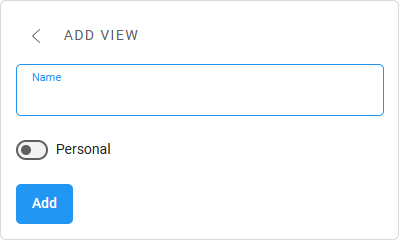
- Click Add to confirm.
Renaming Time Chart view
You must be the space owner to rename the shared space view.
The name of every view can be easily changed with the view settings.
- Open the space.
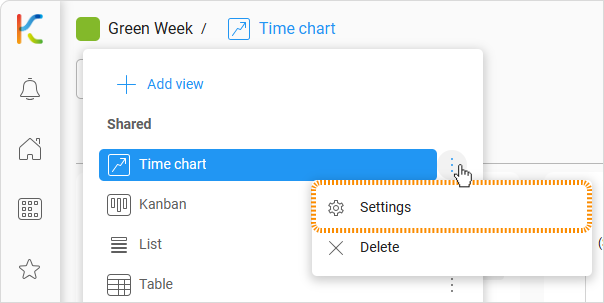
- Click on the current space view button on the top bar.
- Click on the three-dot menu button next to the Time Chart view.
- Select
 Settings.
- Click on the name field.
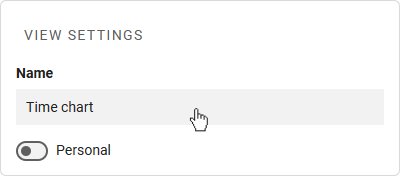
- Enter the new name.
- Click on the Save button.
Deleting Time Chart view
You must be a space owner to delete the shared space view.
To delete a Time Chart view:
- Open the space.
- Click on the current space view button on the top bar.
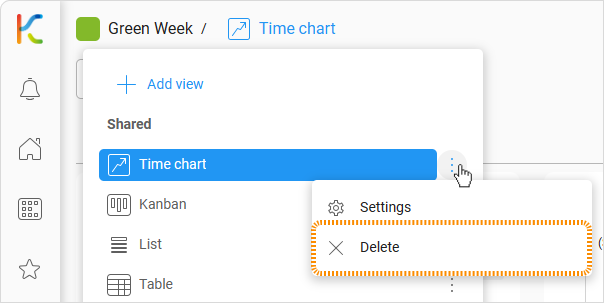
- Click on the three-dot menu button next to the Time Chart view.
- Select the Delete option.
If the space has only one view, you cannot delete it.
Was this article helpful?
Please, contact us if you have any additional questions.